Tsunami Hazard Maps
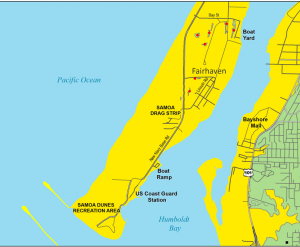
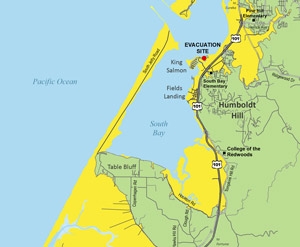
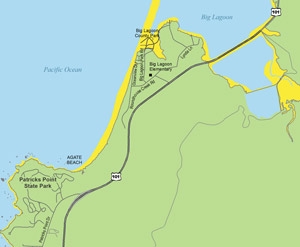
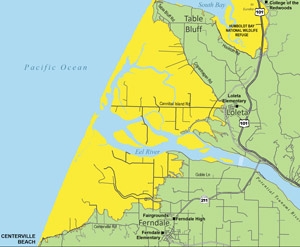
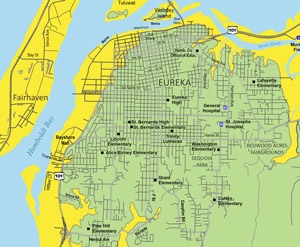
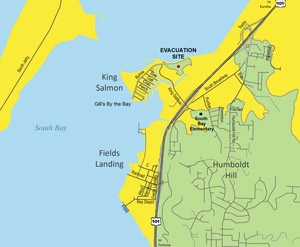
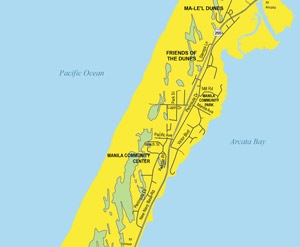
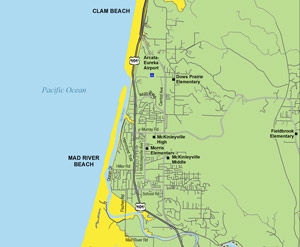
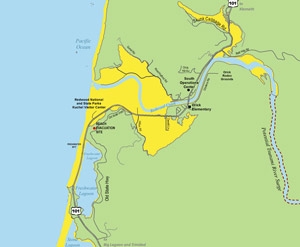
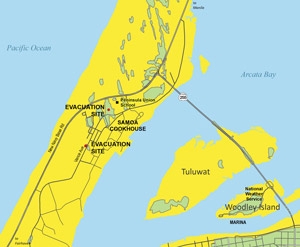
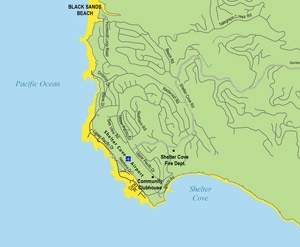
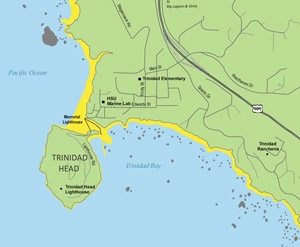
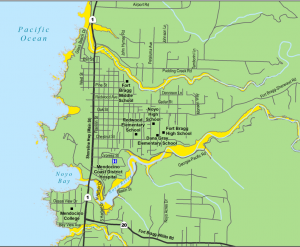
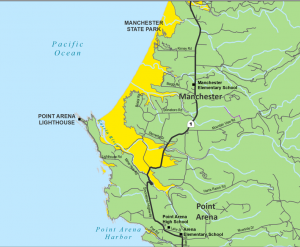
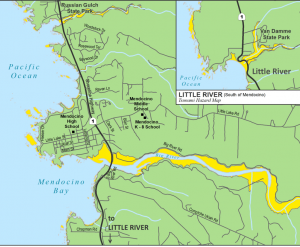
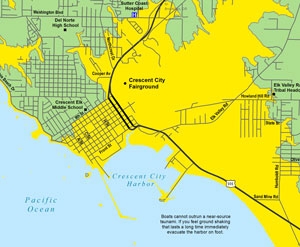
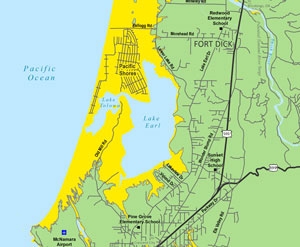
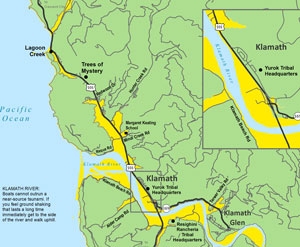
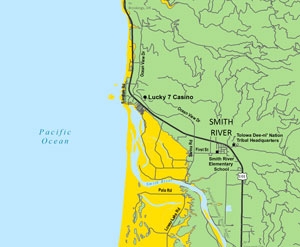
Tsunami safety begins with knowing where a tsunami might hit. This is the tsunami zone and if you are in the zone, you need to evacuate when you feel a large earthquake.
California Geological Survey Tsunami Web App
This web based application displays all the tsunami hazard zones in one easy to use GIS based interactive map. You can explore the Humboldt County maps by checking out the site! This App can be viewed in your web browser.
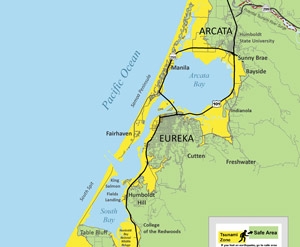
Find where you live or work on the maps or use the State’s interactive map at tsunami.ca.gov. If you are in the YELLOW area, plan a safe evacuation route to the nearest green area.
Tsunami mapping identifies areas that could be flooded by a tsunami. The California Geological Survey (CGS) is responsible for creating our tsunami maps. CGS identifies all possible tsunami sources and models the flooding extent. The models are combined to identify a WORST-CASE line. For Humboldt and Del Norte Counties, the largest tsunami is caused by an earthquake on the Cascadia subduction zone, estimated to be around a magnitude 9.0. In addition to the use of the worst-case scenario earthquake, several assumptions are factored into these maps. It is assumed that the tsunami arrives at high tide and that some land level subsidence (dropping down of the land) occurs during the earthquake. This provides a landward extent of the tsunami flood model that is further extended to the nearest elevation contour plus an additional 1-meter vertical elevation is added to determine the boundary between the yellow and green zones.

Presione aquí para leer esta información en español.
Humboldt County - Interactive PDF
This map contains all Humbodlt city maps in an interactive PDF.
